はじめに
PyFoamはOpenFOAMの操作を効率良く行うことができるPythonモジュールです。
何度もググるのを避けるために自分なりにPyFoamを使ってケーススタディをするときの流れをまとめてみました。 PythonプログラムはすべてJupyter Lab上で動かしています。
使用環境
- Ubuntu 18.04
- OpenFOAM v1812
- PyFoamv 0.6.10
例(pitzDaily)
今回も例としてsimpleFoamによるチュートリアルのpitzDaily(定常非圧縮)を使用します。 チュートリアルでは入口流量が10m/sになっていますが今回は入口流量を5,10,15,20 m/sに変化させた場合についてケーススタディを行っていきます。
インポート
以下のモジュールをインポートします。
import os, shutil
import pandas as pd
from PyFoam.RunDictionary.ParsedParameterFile import ParsedParameterFile
from PyFoam.Execution.BasicRunner import BasicRunner
from PyFoam.Execution.GnuplotRunner import GnuplotRunner

%matplotlib inline
import matplotlib
import matplotlib.pyplot as plt
matplotlib.rcParams['figure.figsize'] = (10.0, 8.0)
from PyFoam.Wrappers.Pandas import PyFoamDataFrame as DataFrame
from PyFoam.IPythonHelpers.Case import Case
またデータ抽出用とプロット作成用に関数も定義しておきます。
# pickledPlot を読み込んでpandas DataFrameに変換する
def newDF(oldPlot):
    dfNames = ['initialResidual', 'finalResidual', 'iteration']
    dfs = {}
    for dfIndex in oldPlot['linear'].columns:
        title = dfIndex
        dfName = dfNames[0]

        if dfIndex.find('_final') > -1:
            dfName = dfNames[1]
            title = dfIndex.replace('_final','')
        elif dfIndex.find('_iterations') > -1:
            dfName = dfNames[2]
            title = dfIndex.replace('_iterations','')

        if not dfName in dfs.keys():
            dfs[dfName] = pd.DataFrame()

        dfs[dfName][title] = oldPlot['linear'][dfIndex]

    for label in ['continuity', 'execution']:
        if label in oldPlot.keys():
            dfs[label] = oldPlot[label]

    return dfs

# そのデータフレームを図示する(final residual以外)
def plotDF(df):
    fig, axes = plt.subplots(ncols=2, nrows=2, figsize=(15,10), sharex=True)
    cargs = {'kind':'line', 'use_index':True}
    n = 0
    for ax, title in zip(axes.ravel(), ['iteration', 'initialResidual', 'execution', 'continuity']):
        cargs['logy'] = (title == 'initialResidual')
        df[title].plot(ax=ax,  **cargs, title=title)
        n += 1
計算の実行
forループで入口速度を変えていきながらそれぞれについて計算させます。 pitzDailyチュートリアルではblockMeshとsimpleFoamを実行することになりますがそれぞれ別の関数を使って実行しています。
# 元となるケースを用意する
orgCase = os.path.join(os.environ['FOAM_TUTORIALS'],'incompressible','simpleFoam','pitzDaily')

# 結果の保存用のディレクトリを用意する
resultDir = './result'
if not os.path.exists(resultDir):
    os.makedirs(resultDir)

# 入口速度を[5,10,15,20]m/sでケーススタディする
for u in range(5,21,5):
    newCase = os.path.join(resultDir,'pitzDaily_U'+str(u))
    if os.path.exists(newCase):
        continue
    shutil.copytree(orgCase, newCase)
    print(newCase)

    # PyFoamを使用してコピーしたケースのinletの速度を変更する
    U =ParsedParameterFile(os.path.join(newCase,'0','U'))
    U.content['boundaryField']['inlet']['value'] = 'uniform ('+str(u)+' 0 0)'
    U.writeFile()

    # 出力無しで実行
    blockMesh = BasicRunner(['blockMesh','-case',newCase], silent=True).start()

    # GNU plotを作成しつつ計算を実行する。ただしGNU plotのウィンドウはいらないので/dev/nullに捨てる。
    simpleFoam = GnuplotRunner(['simpleFoam','-case',newCase],plotBound = False,plotIterations=True,progress=True,plotExecution=True,gnuplotTerminal='/dev/null').start()
    print()
./result/pitzDaily_U5
t =        275
./result/pitzDaily_U10
t =        283
./result/pitzDaily_U15
t =        289
./result/pitzDaily_U20
t =        309
BasicRunnerはその名の通りただ実行するだけです。 ログファイルはPyFoam.blockMesh.logfileという名前で保存されます。
GnuplotRunnerはGNU Plotによる残差などのプロットを同時に行ってくれる関数です。 pyFoamPlotRunner.pyと同じ挙動を示します。 ログファイルを正規表現で解析して表形式にまとめてくれるため今回はこれを用いました。 ちなみにそのまま使うとGNU Plotがポップアップしますが今回は必要ないので出力先を/dev/nullにして捨てています。
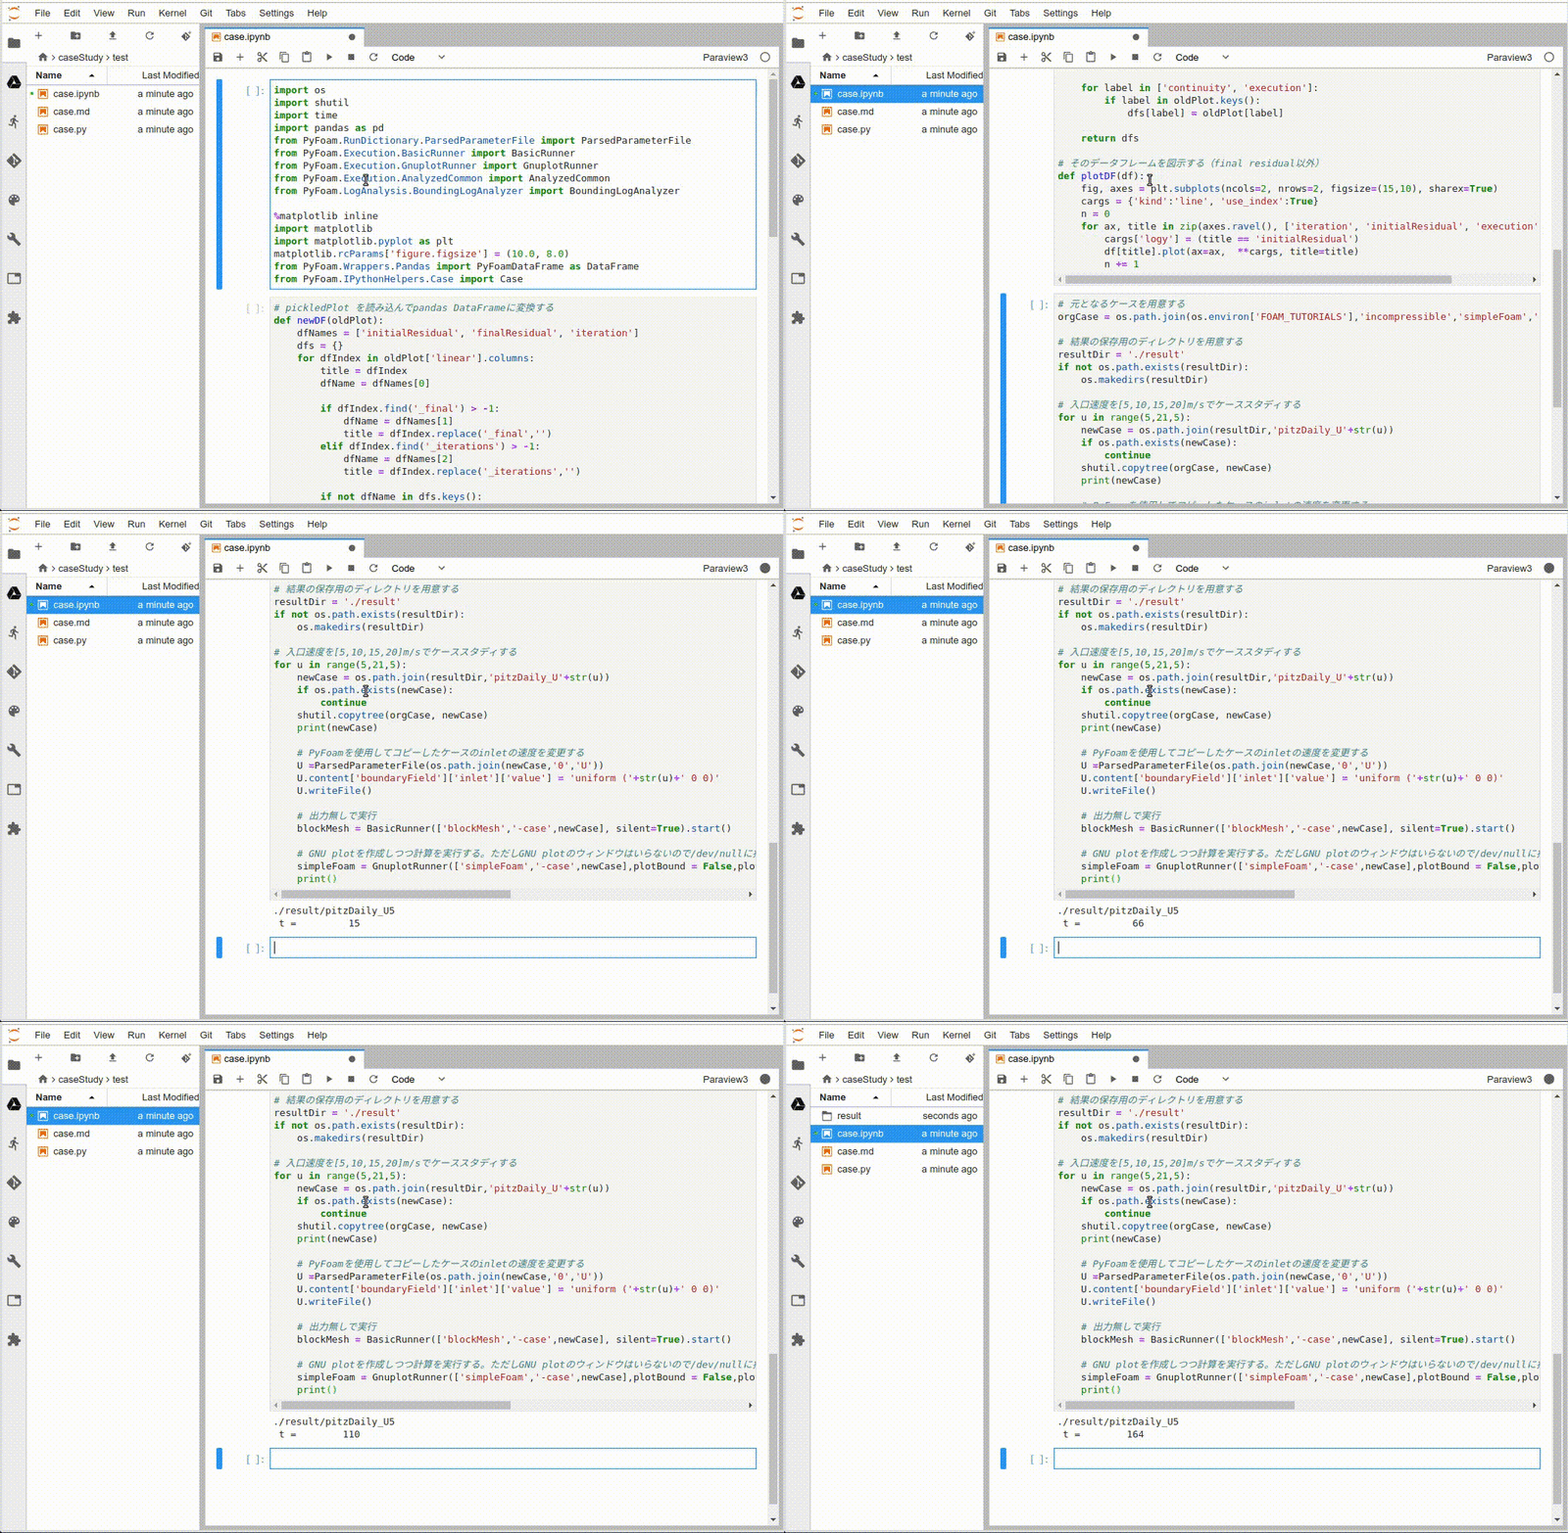
これを実行すると以下のように計算が進んでいることを確認できます。画面ががたがたするのは少し見栄えが悪いですが・・・
解析結果の取り出し
GNU plotでログファイルから抽出されたデータは以下のように取り出します。
# 出力されたプロットをpandasデータフレームで取り出す
dfValue = {} # 項目毎に分けたもの
dfCase = {}  # ケース毎に分けたもの
for u in range(5,21,5):
    newCase = os.path.join(resultDir,'pitzDaily_U'+str(u))
    if not os.path.exists(newCase):
        continue

    title = 'inlet = '+str(u)+'m/s'
    case = Case(newCase)

    pickled = case.sol.pickledPlots[0] # 出力されたファイル'Gnuplotting.analyzed/pickledPlots'のパスの文字列を返す
    dfOrg = newDF(case.pickledPlots(pickled)) # 上記のファイルをpandasデータフレームのdictで返す

    dfCase[title] = dfOrg # ケースごとに保存
    for key in dfOrg.keys():
        for field in dfOrg[key].columns:
            indexName = key+'_'+field
            if not indexName in dfValue:
                dfValue[indexName]= pd.DataFrame()
            dfValue[indexName][title] = dfOrg[key][field] # 分割して項目ごとに保存
print(len(dfCase.keys()))
print(list(dfCase.keys()))
4
['inlet = 5m/s', 'inlet = 10m/s', 'inlet = 15m/s', 'inlet = 20m/s']
GnuplotRunnerで出力されるファイルは以下のようにすることで取り出すことができます。plotsにはpandas.DataFrameのdictが格納されます。
case = Case(newCase)
pickled = case.sol.pickledPlots[0]
plots = case.pickledPlots(pickled))
ちょっと扱いやすくするために最初のnewDF関数で少し加工しています。
結果のプロット①
まず入口速度5m/sのときの計算ログを見てみます。 このように各ケースのプロットを一括で見ることができます。
df5 = dfCase[list(dfCase.keys())[0]]
print(len(df5.keys()))
print(list(df5.keys()))
5
['initialResidual', 'finalResidual', 'iteration', 'continuity', 'execution']
plotDF(df5)

結果のプロット②
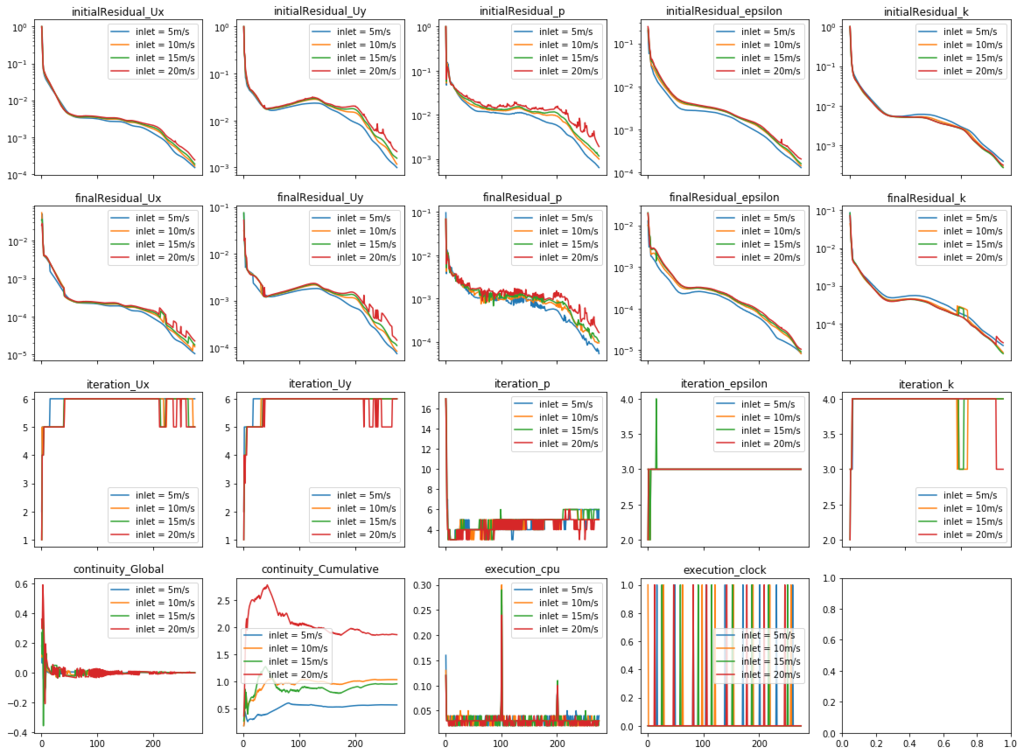
すべてのログをケースごとに比較してみました。 こうすることで収束のしやすさなどを直感的に見ることができるかもしれません。
print(len(dfValue.keys()))
print(list(dfValue.keys()))
19
['initialResidual_Ux', 'initialResidual_Uy', 'initialResidual_p', 'initialResidual_epsilon', 'initialResidual_k', 'finalResidual_Ux', 'finalResidual_Uy', 'finalResidual_p', 'finalResidual_epsilon', 'finalResidual_k', 'iteration_Ux', 'iteration_Uy', 'iteration_p', 'iteration_epsilon', 'iteration_k', 'continuity_Global', 'continuity_Cumulative', 'execution_cpu', 'execution_clock']
fig, axes = plt.subplots(nrows=4, ncols=5, figsize=(20, 15))
n = 0
for r in range(4):
    for c in range(5):
        if n == len(dfValue.keys()):
            continue
        title = list(dfValue.keys())[n]
        logy = False
        if title.find('Residual') > -1:
            logy = True
        dfValue[title].plot(ax=axes[r, c], kind='line', title = title, sharex = True, logy = logy)
        n += 1

最後に
とりあえずケーススタディに関して簡単にまとめてみました。 PyFoamは素晴らしい機能がいっぱい入っていますので少しずつ紹介していけたらと思います。
